How Real-Time Dashboards Stop Project Profitability from Slipping Away
Margins in construction are razor-thin. You think you're doing fine until the final invoice arrives, and suddenly you’re wondering where all the profit went. Sound familiar? It’s not just you. Many contractors face this problem. The culprit? A lack of real-time visibility into project costs.
I’ve seen this happen too many times: A large project starts on solid footing. The budget looks good, the timeline is manageable, and everyone’s optimistic. But as the weeks go by, small cost overruns and delays creep in. Materials cost more than expected. Labor hours run over. Subcontractors submit higher-than-expected bills. By the end, you’re lucky to break even.
The Real Problem: Disconnected Data
The biggest issue? Most contractors rely on disconnected systems. Procurement is in one tool, billing in another, and cost tracking is done manually on spreadsheets. By the time you consolidate all this data, it’s too late to do anything about it. The damage is done.
For example, one contractor I worked with handled billing through Excel templates, tracked labor hours in WhatsApp chats, and used site managers’ daily reports for material usage. When they finally reviewed project profitability three months after completion, they realized they’d lost ₹25 lakh on labor overruns alone. Worse, they didn’t even know where the extra hours went.
Disconnected systems also increase the likelihood of human error. Manual data entry and cross-referencing spreadsheets can lead to missed details, duplicate entries, and overlooked costs — all of which chip away at your margins.
How Real-Time Dashboards Save the Day
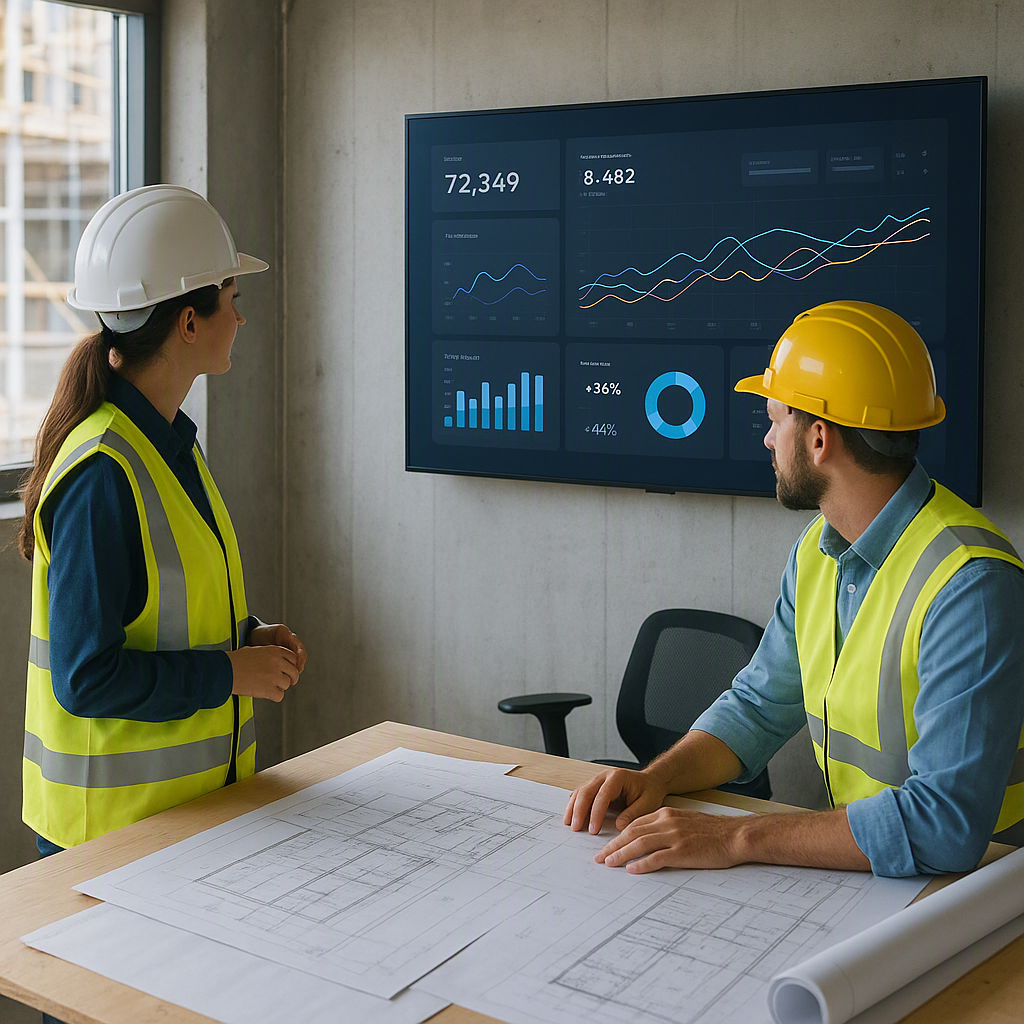
This is where real-time dashboards make all the difference. Unlike static reports or disjointed spreadsheets, dashboards pull live data from every part of your business — procurement, labor, equipment, and billing. They give you a clear, up-to-the-minute picture of project costs and progress.
Here’s how they help:
-
Catch Cost Overruns Early Imagine you’re managing a road construction project with a ₹10 crore budget. Your BOQ estimates ₹2 crore for labor. A real-time dashboard tracking attendance and payroll can instantly alert you if labor costs are exceeding projections. Instead of waiting until the project ends, you can investigate immediately — perhaps an unexpected site delay is driving overtime costs. Fix it now, not later.
Actionable Step: Set up automatic alerts on your dashboard for key cost categories, like labor, materials, and equipment. Regularly review these alerts and investigate discrepancies as soon as they appear.
-
Track Resource Allocation Across Sites Many contractors manage multiple sites simultaneously. Equipment and labor often get shuffled between projects without proper tracking. Real-time dashboards show where your resources are being used, preventing underutilization or double-booking. For example, if a backhoe meant for Project A is being used on Project B, you’ll know right away.
Actionable Step: Use GPS-enabled tracking for large equipment and site-specific attendance tracking for labor. Integrate this data with your dashboard to visualize resource allocation in real time.
-
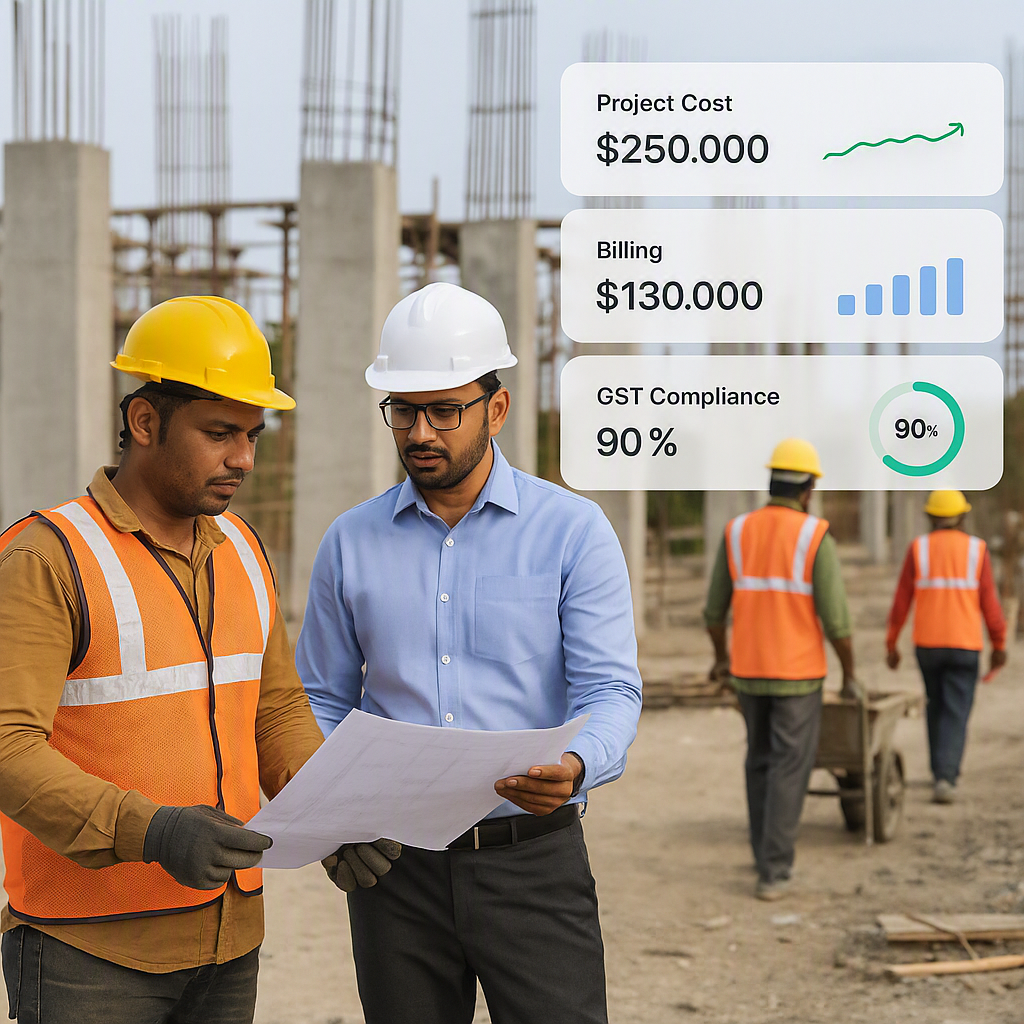
Prevent Revenue Leakage in Billing Billing errors are a silent margin killer. Missed line items or incorrect measurements can cost lakhs. Dashboards tied to your BOQ and scope track every billable item — RA bills, stage-wise payments, material supplies — ensuring nothing gets missed. JobNext.ai’s 6 billing methods are built for exactly this.
Actionable Step: Implement measurement-based billing workflows in your dashboard. Double-check RA bills against site progress data before submitting invoices to clients.
-
Monitor Subcontractor Costs in Real Time Subcontractors are notorious for submitting inflated bills. Real-time dashboards paired with measurement-based tracking let you verify progress before approving payments. If a subcontractor claims they’ve completed 70% of a task but measurements show only 60%, you can reject the excess claim immediately.
Actionable Step: Require subcontractors to submit progress reports tied to measurable milestones (e.g., cubic meters poured, square meters tiled). Integrate these reports into your dashboard for instant validation.
What Makes a Good Dashboard?
Not all dashboards are created equal. Here’s what to look for:
- Integration: Your dashboard should pull data from every department — HR, finance, procurement, and project management. Disconnected dashboards defeat the purpose.
- Customization: Pre-built templates are fine, but you need to customize views based on roles. A procurement manager needs different data than a project site manager.
- Drill-Down Capability: Summary data is great, but you should be able to drill down into specific line items — like individual labor costs or material invoices.
- Real-Time Updates: If your dashboard refreshes only once a day, it’s already outdated. Look for tools that sync live.
Decision Framework: Choosing the Right Dashboard
| Feature | Importance Level | Example Tools |
|---|---|---|
| Integration Across Departments | High | ProjectsNext, JobNext.ai |
| Real-Time Updates | High | ProjectsNext |
| Customizable Views | Medium | MS Power BI, Tableau |
| User Training & Support | High | JobNext.ai |
| Cost of Implementation | Medium | Cloud-based ERPs |
Common Mistakes with Dashboards (and How to Avoid Them)
-
Focusing Only on Financials: Dashboards aren’t just for profit and loss. Track operational metrics like material wastage or equipment downtime too. These are the root causes of cost overruns.
Actionable Step: Create separate tabs or views for operational metrics alongside financial data.
-
Ignoring User Training: Even the best dashboard is useless if your team doesn’t know how to use it. Train site managers, procurement teams, and finance staff to input accurate data and interpret reports.
Actionable Step: Invest in onboarding sessions and hands-on training for your team when adopting a new dashboard tool.
-
Overloading with Data: Too much data can be as bad as too little. Focus on key metrics like cost variance, scope progress, and resource utilization. Simplify, don’t complicate.
Actionable Step: Use color-coded visuals and graphs to highlight critical data points.
FAQs
1. How often should dashboards be updated?
Dashboards should ideally update in real time or at least every few minutes. The goal is to spot issues as they arise, not weeks later.
2. What if my team isn’t tech-savvy?
User-friendly interfaces are key. Many modern ERP systems, like ProjectsNext, include customizable dashboards and offer dedicated training for your team.
3. Aren’t dashboards expensive?
Not anymore. Cloud-based ERPs make these tools affordable even for small contractors. Plus, the cost of inefficiency far outweighs the investment.
4. Can dashboards work for small projects?
Absolutely. Even smaller projects benefit, especially when you’re managing multiple jobs at once. Dashboards help you see the full picture without juggling spreadsheets.
5. What’s the ROI on a real-time dashboard?
While it varies, the biggest returns come from preventing cost overruns and spotting inefficiencies early. Think of it as avoiding losses rather than chasing gains.
In Summary
Real-time dashboards aren’t just a luxury — they’re a necessity for any contractor serious about profitability. They provide the visibility you need to catch problems early, manage resources effectively, and prevent revenue leakage. Without them, you’re essentially flying blind.
If you’re tired of watching your margins disappear, it’s time to take control. ProjectsNext offers real-time dashboards tailored to contractors. Get started today and stop the leak before it sinks your projects.
Learn more at JobNext.ai - Construction ERP